A customer journey map tells the story of a service from the point of view of the person using it. Step by step, it shows what they do, what they think and how they feel, from the moment they first need the service to long after they have finished with it. Mapping it together is one of the best ways to help a team see a service as its users do.
Customer journey mapping is a core tool in service design. Despite the name, it works just as well for patients, tenants, residents, students, volunteers or staff. A good map is built on evidence from real people, so it’s most powerful after some user research, such as interviews, observation or a Photovoice project. Running the session as a workshop brings together people who each see only part of the journey, and helps them agree what to fix first.
Method
Choose whose journey you are mapping, set out the stages, fill in what happens at each step, find the pain points and opportunities, then agree priorities.
Step 1: Choose the person and the journey
Agree whose journey you are mapping and where it starts and ends, for example “a parent applying for a school place, from finding out they need to apply to their child’s first day”. If different groups of users have very different experiences, map them separately, using a persona for each one.
Step 2: Share the evidence
Spend 15 to 20 minutes walking the group through what you know from research: quotes, observations, complaints and data. Put the most striking quotes on the wall where everyone can see them. Remind people throughout that the map should show what people actually experience, not what the process says should happen.
Step 3: Set out the stages
Along the top of the map, agree five to eight broad stages, such as Finding out, Applying, Waiting, Using the service and Afterwards. Then mark out rows underneath for:
- Actions: what the person does at each step.
- Touchpoints: where they interact with the service, such as a website, a letter, a phone call or a reception desk.
- Thoughts and feelings: what they are thinking, feeling and worrying about, ideally in their own words.
- Pain points: what goes wrong, causes delay or frustration, or makes people give up.
- Opportunities: ideas for making that moment better.
Step 4: Map the actions and touchpoints
In small groups, fill in the actions and touchpoints for each stage, using one colour of sticky note. Be as specific as you can: “waits three weeks for a letter” is more useful than “waits”.
Step 5: Add thoughts, feelings and the emotional curve
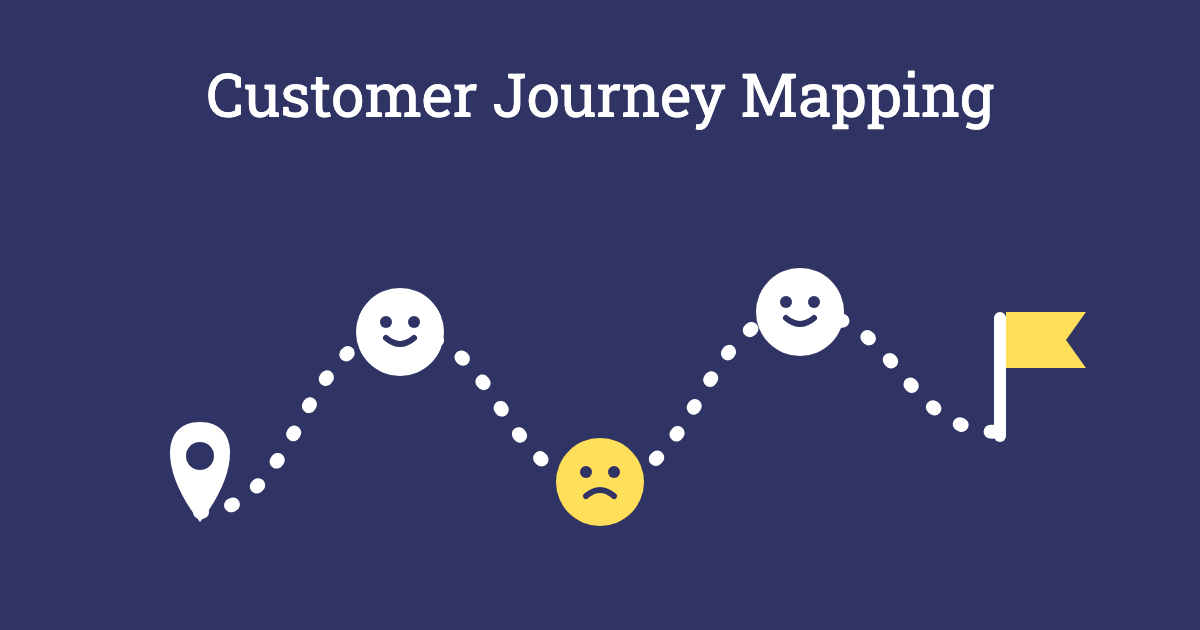
Using the research, add what the person is likely to be thinking and feeling at each step, in a second colour. Then draw a line across the map that rises and falls with how they feel, from delighted at the top to frustrated or anxious at the bottom. The low points usually jump out straight away.
Step 6: Mark the pain points
In a third colour, note what goes wrong at each step, especially around the low points of the curve. Look for handovers between teams, repeated questions, long waits, confusing letters and moments where people have to chase.
Step 7: Generate opportunities
In a fourth colour, add ideas for improving each pain point. Encourage a mix of quick fixes, such as rewriting a confusing letter, and bigger changes, such as joining up two teams.
Step 8: Prioritise and agree next steps
Use dot voting to choose the moments that matter most to the person using the service, then plot the ideas for those moments on an Impact/Effort Matrix. Agree which ideas to test, who will do what, and how you will check whether the changes work for users.
Outcome
A shared, visual picture of the service from the user’s point of view, with the biggest pain points and opportunities clearly marked. Teams who usually see only their own part of the service understand how it all fits together, and leave with agreed priorities for improvement that are grounded in evidence rather than assumptions.
Tips for Facilitators
- Bring evidence, not guesses: without research, a journey map shows what staff think happens. Invite people who use the service, or bring their words, photos and stories into the room.
- Map the real journey: include the messy parts, such as the phone calls to chase a reply, the forms filled in twice and the steps that happen outside the service.
- Mix the groups: put frontline staff, managers and other teams together, so the people who see different parts of the journey learn from each other.
- Watch for defensiveness: pain points can feel like criticism of people’s work. Keep the focus on the experience and the system, not on individuals.
- Photograph and type it up: the wall won’t last, so capture the map the same day and share a tidy version with everyone who took part.
Variations
- Future journey: once you have mapped the current journey, map the journey you want people to have, and work out what needs to change to get there.
- Service blueprint: add rows underneath for what staff and systems do behind the scenes at each step, to see where the service needs to change internally.
- Walk the journey: before the session, ask the team to go through the service as a user would, for example by applying online or phoning the helpline, and bring what they found.
- Start with the worst: warm up with World’s Worst [X] to get people thinking about what a terrible experience of the service would look like.
Accessibility and Online Sessions
Make sure the map is at a height everyone can reach, and that there is space to move around it. Use large, clear writing and high-contrast sticky notes, and read the key points aloud as the map grows. When you map a service, include the experience of disabled people and people with other access needs, as their journeys often reveal the most important pain points. Online, use a digital whiteboard with a journey map template, prepare the rows and stages in advance, and give each breakout group its own section of the map.